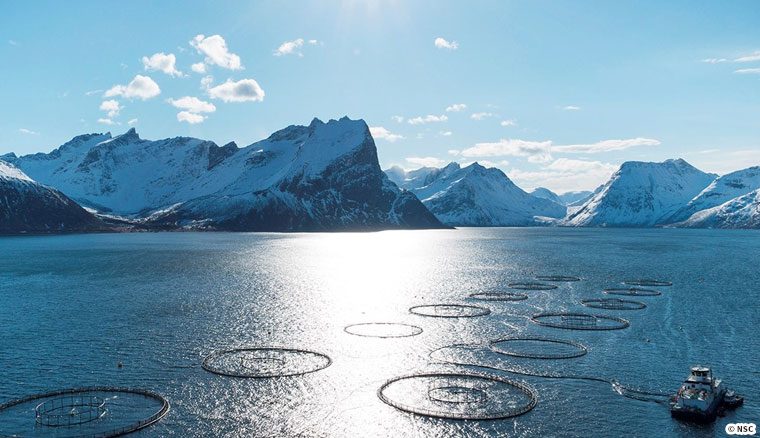
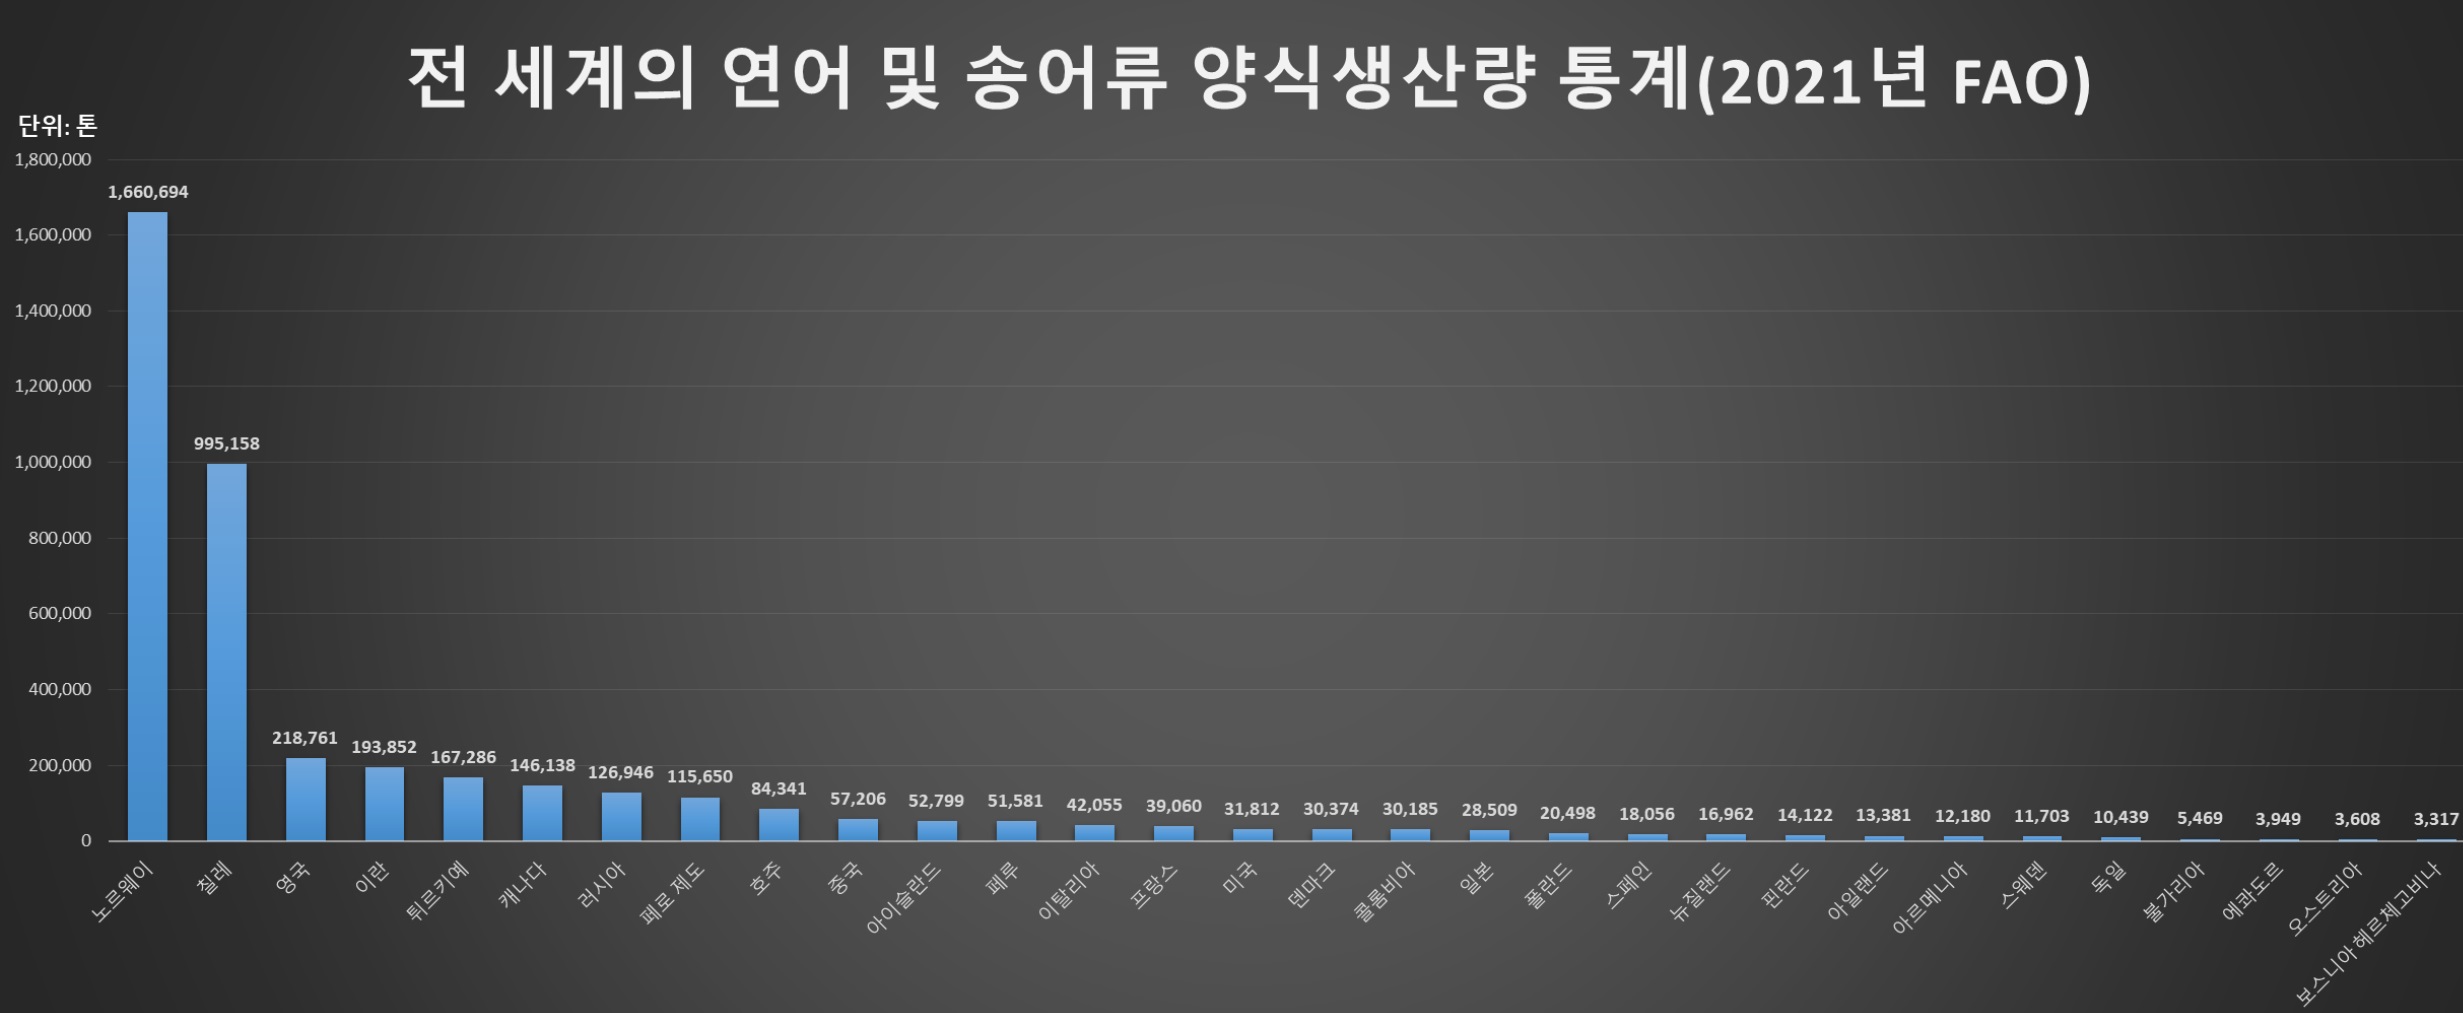
Global Salmon and Trout Farming Production Statistics (2021 FAO)
This compares statistics on salmon and trout aquaculture production from around the world. The species are classified according to FAO’s ISCCAAP, and include salmon, trout, trout, icefish, and smelt.
|
ranking
|
Country name
|
Unit: ton
|
|
1
|
Norway
|
1,660,694
|
|
2
|
Chile
|
995,158
|
|
3
|
uk
|
218,761
|
|
4
|
Iran
|
193,852
|
|
5
|
Turkiye
|
167,286
|
|
6
|
Canada
|
146,138
|
|
7
|
russia
|
126,946
|
|
8
|
Faroe Islands
|
115,650
|
|
9
|
australia
|
84,341
|
|
10
|
china
|
57,206
|
|
11
|
Iceland
|
52,799
|
|
12
|
Peru
|
51,581
|
|
13
|
Italy
|
42,055
|
|
14
|
france
|
39,060
|
|
15
|
USA
|
31,812
|
|
16
|
Denmark
|
30,374
|
|
17
|
Colombia
|
30,185
|
|
18
|
japan
|
28,509
|
|
19
|
Poland
|
20,498
|
|
20
|
Spain
|
18,056
|
|
21
|
New Zealand
|
16,962
|
|
22
|
Finland
|
14,122
|
|
23
|
Ireland
|
13,381
|
|
24
|
Armenia
|
12,180
|
|
25
|
Sweden
|
11,703
|
|
26
|
germany
|
10,439
|
|
27
|
Bulgaria
|
5,469
|
|
28
|
Ecuador
|
3,949
|
|
29
|
Austria
|
3,608
|
|
30
|
Bosnia and Herzegovina
|
3,317
|
|
31
|
North Macedonia
|
2,866
|
|
32
|
korea
|
2,765
|
|
33
|
Romania
|
2,747
|
|
34
|
Argentina
|
2,177
|
|
35
|
taiwan
|
2,167
|
|
36
|
Kyrgyzstan
|
2,150
|
|
37
|
brazil
|
1,994
|
|
38
|
Greece
|
1,911
|
|
39
|
Albania
|
1,861
|
|
40
|
Serbia
|
1,556
|
|
41
|
Bolivia
|
1,500
|
|
41
|
Lesotho
|
1,500
|
|
43
|
Swiss
|
1,453
|
|
44
|
Georgia
|
1,426
|
|
45
|
South Africa
|
1,145
|
|
46
|
Mexico
|
1,083
|
|
47
|
Czechia
|
1,072
|
|
48
|
India
|
1,000
|
|
49
|
Kazakhstan
|
947
|
|
50
|
Slovenian
|
931
|
|
51
|
Costa Rica
|
900
|
|
52
|
Portugal
|
857
|
|
53
|
Slovakia
|
800
|
|
54
|
Lebanon
|
750
|
|
55
|
Estonia
|
712
|
|
56
|
Nepal
|
668
|
|
57
|
Kenya
|
600
|
|
58
|
Montenegro
|
561
|
|
59
|
Israel
|
400
|
|
60
|
Croatia
|
350
|
|
61
|
Ukraine
|
312
|
|
62
|
Morocco
|
300
|
|
63
|
Uzbekistan
|
230
|
|
64
|
Latvia
|
183
|
|
65
|
United Arab Emirates
|
180
|
|
66
|
Papua New Guinea
|
150
|
|
67
|
Lithuania
|
131
|
|
68
|
Belarus
|
127
|
|
69
|
Guatemala
|
106
|
|
70
|
Azerbaijan
|
104
|
|
70
|
Tajikistan
|
104
|
|
72
|
Hungary
|
74
|
|
73
|
North Korea
|
60
|
|
74
|
Ethiopia
|
55
|
|
75
|
Cyprus
|
52
|
|
76
|
Netherlands
|
50
|
|
76
|
Venezuela
|
50
|
|
78
|
Afghanistan
|
40
|
|
79
|
Malawi
|
35
|
|
80
|
Zimbabwe
|
35
|
|
81
|
Reunion
|
25
|
|
82
|
butane
|
20
|
|
83
|
Panama
|
10
|


Leave a Reply
Want to join the discussion?Feel free to contribute!