On January 19, KBS reported an article titled, “The Return of the ‘Sweeping’ Chinese Fishing Fleet, Advancing Even to South America… “Are They Actually a Maritime Militia?”
The main point of the report was that China’s illegal fishing was widespread throughout the world and that the Chinese government had military objectives behind it.
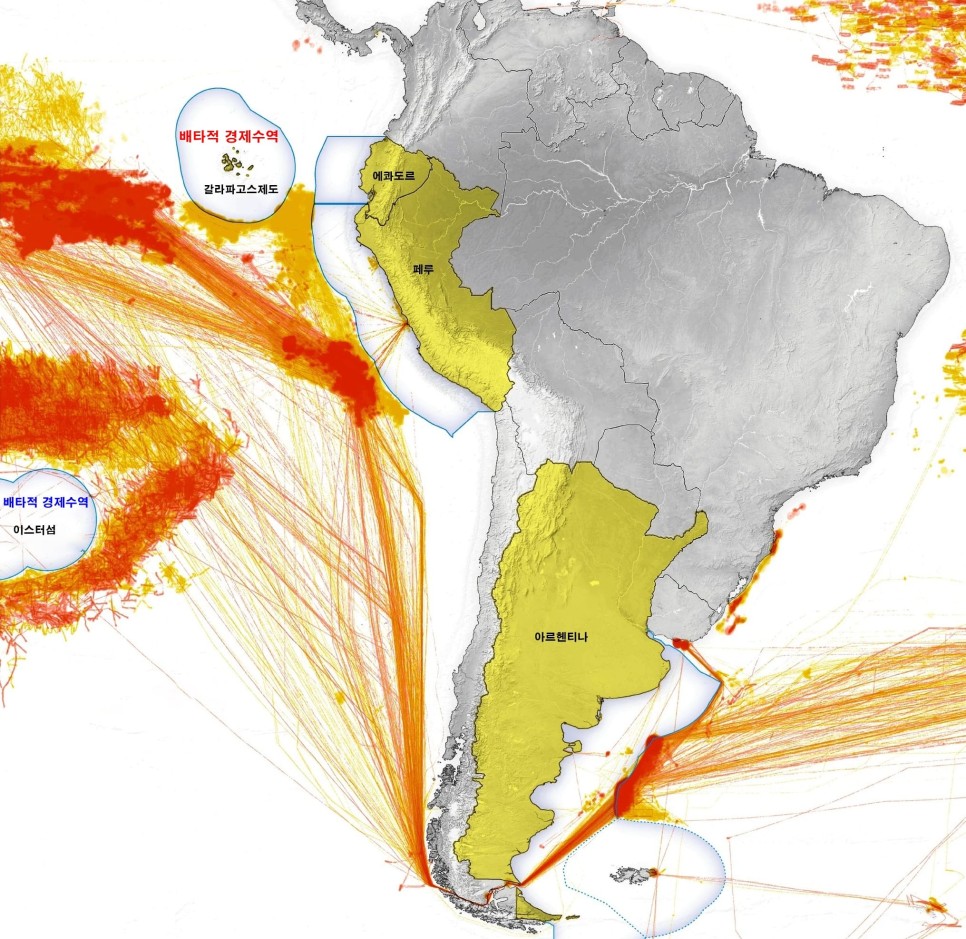
Late last year, the world widely reported the news that some 300 Chinese fishing boats were threatening the ecosystem and causing many problems for the economies of neighboring countries by conducting sweeping fishing operations in the Galapagos Islands.
The 300 Chinese fishing boats are said to account for 99% of the catch around the Galapagos Islands. The picture below clearly shows how many Chinese fishing boats are sweeping South America.
The yellow and red lines indicate the Chinese fishing boats’ routes, with the yellow line being from 2020 and the red line from 2021.
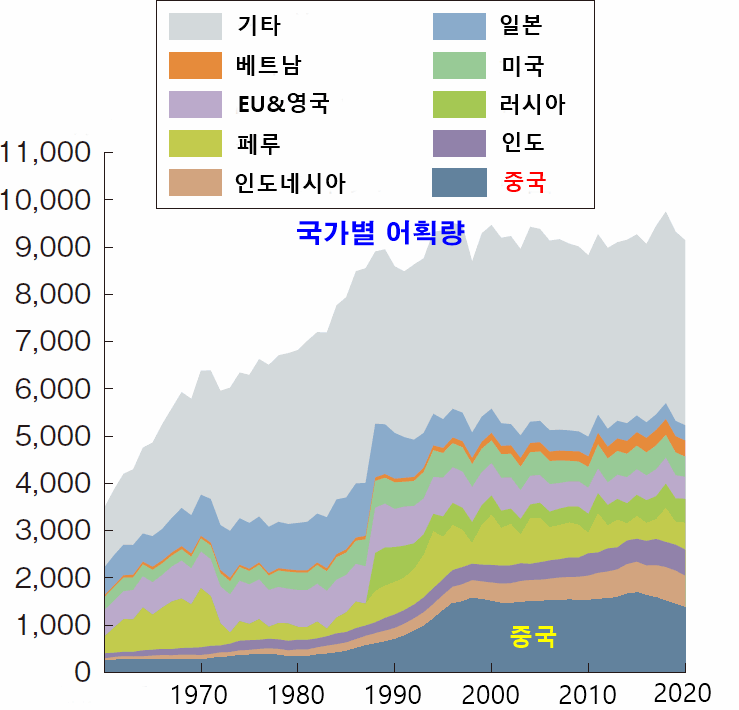
Looking at this, it’s easy to think that China is sweeping up the world’s seafood, but China’s catch has never exceeded 20% of the world’s total.
Yet, with reports pouring in warning of the depletion of global fisheries and the destruction of ecosystems, what would happen if their catch exceeded 20%?
Currently, the world’s fisheries resources are at only 66% of sustainable levels, and if China continues its uncooperative approach to management, seafood may gradually disappear from our tables.
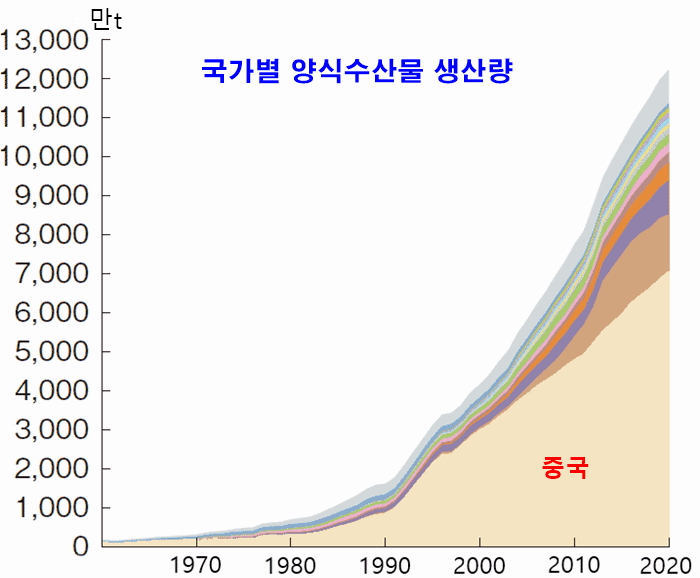
It may be a small consolation that China’s aquaculture production accounts for over 60% of the world’s total, but without international efforts and China’s awakening, it is clear that the rate at which aquatic resources are being depleted will only accelerate.
Lastly, according to FAO data, the statistics for the combined catch and aquaculture production of fisheries products from 230 countries around the world in 2020 are as follows: China produced 83.93 million tons, taking first place with a 39.22% share, and Korea produced 3.7 million tons, taking 12th place with a 1.73% share.
| ranking | Country name | Production (tons) | Market share |
| 1 | china | 83,929,521 | 39.22% |
| 2 | Indonesia | 21,834,396 | 10.20% |
| 3 | India | 14,164,000 | 6.62% |
| 4 | vietnam | 8,036,572 | 3.76% |
| 5 | Peru | 5,819,039 | 2.72% |
| 6 | russia | 5,372,211 | 2.51% |
| 7 | USA | 4,701,771 | 2.20% |
| 8 | Bangladesh | 4,503,371 | 2.10% |
| 9 | Philippines | 4,237,686 | 1.98% |
| 10 | japan | 4,211,428 | 1.97% |
| 11 | Norway | 4,093,986 | 1.91% |
| 12 | korea | 3,703,318 | 1.73% |
| 13 | Chile | 3,688,254 | 1.72% |
| 14 | Myanmar | 2,998,582 | 1.40% |
| 15 | thailand | 2,617,847 | 1.22% |
| 16 | Egypt | 2,010,579 | 0.94% |
| 17 | malaysia | 1,793,021 | 0.84% |
| 18 | Mexico | 1,790,586 | 0.84% |
| 19 | Ecuador | 1,409,760 | 0.66% |
| 20 | Morocco | 1,399,151 | 0.65% |
| 21 | brazil | 1,339,591 | 0.63% |
| 22 | Iran | 1,282,381 | 0.60% |
| 23 | Spain | 1,080,966 | 0.51% |
| 24 | Iceland | 1,075,309 | 0.50% |
| 25 | Nigeria | 1,044,812 | 0.49% |
| 26 | Cambodia | 933,260 | 0.44% |
| 27 | Canada | 910,687 | 0.43% |
| 28 | taiwan | 885,029 | 0.41% |
| 29 | North Korea | 882,300 | 0.41% |
| 30 | uk | 847,043 | 0.40% |
| 31 | Argentina | 839,674 | 0.39% |
| 32 | Oman | 794,726 | 0.37% |
| 33 | Turkiye | 785,822 | 0.37% |
| 34 | Denmark | 775,519 | 0.36% |
| 35 | Faroe Islands | 735,345 | 0.34% |
| 36 | Uganda | 690,158 | 0.32% |
| 37 | Mauritania | 678,425 | 0.32% |
| 38 | france | 657,222 | 0.31% |
| 39 | Pakistan | 655,245 | 0.31% |
| 40 | South Africa | 612,456 | 0.29% |
| 41 | Tanzania | 488,500 | 0.23% |
| 42 | New Zealand | 483,089 | 0.23% |
| 43 | Senegal | 452,848 | 0.21% |
| 44 | Sri Lanka | 429,162 | 0.20% |
| 45 | Ghana | 420,371 | 0.20% |
| 46 | Mozambique | 403,116 | 0.19% |
| 47 | Angola | 379,407 | 0.18% |
| 48 | Netherlands | 345,027 | 0.16% |
| 49 | Namibia | 329,936 | 0.15% |
| 50 | Venezuela | 312,033 | 0.15% |
| 51 | Guinea | 310,705 | 0.15% |
| 52 | australia | 285,925 | 0.13% |
| 53 | Cameroon | 285,186 | 0.13% |
| 54 | Italy | 264,550 | 0.12% |
| 55 | Greenland | 259,209 | 0.12% |
| 56 | Colombia | 256,666 | 0.12% |
| 57 | Poland | 254,090 | 0.12% |
| 58 | Ireland | 246,253 | 0.12% |
| 59 | germany | 244,353 | 0.11% |
| 60 | Georgia | 233,177 | 0.11% |
| 61 | Papua New Guinea | 223,899 | 0.10% |
| 62 | Democratic Republic of the Congo | 221,340 | 0.10% |
| 63 | Kiribati | 212,753 | 0.10% |
| 64 | Greece | 203,213 | 0.09% |
| 65 | Sierra Leone | 200,715 | 0.09% |
| 66 | Laos | 200,021 | 0.09% |
| 67 | Federated States of Micronesia | 193,748 | 0.09% |
| 68 | Sweden | 191,733 | 0.09% |
| 69 | Panama | 191,584 | 0.09% |
| 70 | Belize | 187,464 | 0.09% |
| 71 | Malawi | 180,508 | 0.08% |
| 72 | Portugal | 174,500 | 0.08% |
| 73 | Saudi Arabia | 161,849 | 0.08% |
| 74 | Finland | 156,181 | 0.07% |
| 75 | Zambia | 152,506 | 0.07% |
| 76 | Maldive Islands | 148,565 | 0.07% |
| 77 | Uzbekistan | 144,103 | 0.07% |
| 78 | Kenya | 143,810 | 0.07% |
| 79 | Seychelles | 132,416 | 0.06% |
| 80 | Yemen | 131,307 | 0.06% |
| 81 | Zanzibar, Tanzania | 127,788 | 0.06% |
| 82 | Tunisia | 126,739 | 0.06% |
| 83 | Mali | 125,376 | 0.06% |
| 84 | Madagascar | 124,710 | 0.06% |
| 85 | Hong Kong | 123,263 | 0.06% |
| 86 | Côte d’Ivoire | 108,031 | 0.05% |
| 87 | Chad | 107,105 | 0.05% |
| 88 | Latvia | 104,201 | 0.05% |
| 89 | Nepal | 97,822 | 0.05% |
| 90 | Lithuania | 95,561 | 0.04% |
| 91 | Croatia | 93,343 | 0.04% |
| 92 | Nauru | 92,389 | 0.04% |
| 93 | Marshall Islands | 88,212 | 0.04% |
| 94 | Ukraine | 87,213 | 0.04% |
| 95 | Honduras | 86,970 | 0.04% |
| 96 | Algeria | 86,901 | 0.04% |
| 97 | Nicaragua | 79,113 | 0.04% |
| 98 | backpack | 76,952 | 0.04% |
| 99 | Estonia | 75,233 | 0.04% |
| 100 | Republic of the Congo | 71,537 | 0.03% |
| 101 | United Arab Emirates | 69,529 | 0.03% |
| 102 | Falkland Islands | 65,978 | 0.03% |
| 103 | Uruguay | 62,983 | 0.03% |
| 104 | Guinea-Bissau | 62,392 | 0.03% |
| 105 | El Salvador | 61,489 | 0.03% |
| 106 | Ethiopia | 60,536 | 0.03% |
| 107 | Iraq | 57,474 | 0.03% |
| 108 | Kazakhstan | 52,610 | 0.02% |
| 109 | Vanuatu | 51,563 | 0.02% |
| 110 | Gambia | 51,023 | 0.02% |
| 111 | method | 47,510 | 0.02% |
| 112 | Niger | 46,649 | 0.02% |
| 113 | Solomon Islands | 46,521 | 0.02% |
| 114 | Cuba | 46,386 | 0.02% |
| 115 | Guatemala | 44,927 | 0.02% |
| 116 | Fiji | 43,045 | 0.02% |
| 117 | Guyana | 40,125 | 0.02% |
| 118 | Rwanda | 37,038 | 0.02% |
| 119 | Zimbabwe | 34,163 | 0.02% |
| 120 | Costa Rica | 33,664 | 0.02% |
| 121 | Liberia | 31,884 | 0.01% |
| 122 | Libya | 31,637 | 0.01% |
| 123 | Paraguay | 31,075 | 0.01% |
| 124 | South Sudan | 30,030 | 0.01% |
| 125 | Somalia | 30,000 | 0.01% |
| 126 | surname | 29,809 | 0.01% |
| 127 | Burkina Faso | 29,755 | 0.01% |
| 128 | Mauritius | 29,287 | 0.01% |
| 129 | Central Africa | 29,219 | 0.01% |
| 130 | Gabon | 29,060 | 0.01% |
| 131 | Czechia | 24,130 | 0.01% |
| 132 | Hungary | 23,780 | 0.01% |
| 133 | Curaçao | 23,050 | 0.01% |
| 134 | Malta | 21,933 | 0.01% |
| 135 | Bulgaria | 21,348 | 0.01% |
| 136 | Burundi | 21,039 | 0.01% |
| 137 | Comoros | 20,755 | 0.01% |
| 138 | Romania | 20,173 | 0.01% |
| 139 | Belgium | 20,163 | 0.01% |
| 140 | Cape Verde | 19,314 | 0.01% |
| 141 | Armenia | 18,892 | 0.01% |
| 142 | Togo | 18,764 | 0.01% |
| 143 | Haiti | 17,910 | 0.01% |
| 144 | Albania | 16,911 | 0.01% |
| 145 | Israel | 16,716 | 0.01% |
| 146 | Brunei | 16,591 | 0.01% |
| 147 | catarrh | 15,109 | 0.01% |
| 148 | Turkmenistan | 14,755 | 0.01% |
| 149 | Bahrain | 14,420 | 0.01% |
| 150 | French Polynesia | 14,107 | 0.01% |
| 151 | Jamaica | 13,792 | 0.01% |
| 152 | Trinidad and Tobago | 12,917 | 0.01% |
| 153 | Moldova | 12,650 | 0.01% |
| 154 | Dominican Republic | 12,560 | 0.01% |
| 155 | Tuvalu | 11,297 | 0.01% |
| 156 | Bolivia | 11,220 | 0.01% |
| 157 | Belarus | 10,205 | 0.00% |
| 158 | Afghanistan | 10,050 | 0.00% |
| 159 | Samoa | 9,966 | 0.00% |
| 160 | East Timor | 9,135 | 0.00% |
| 161 | Cyprus | 8,608 | 0.00% |
| 162 | Serbia | 7,942 | 0.00% |
| 163 | Bahamas | 7,439 | 0.00% |
| 164 | Singapore | 6,247 | 0.00% |
| 165 | Syria | 6,145 | 0.00% |
| 166 | Equatorial Guinea | 6,057 | 0.00% |
| 167 | Sao Tome and Principe | 5,617 | 0.00% |
| 168 | Eritrea | 5,565 | 0.00% |
| 169 | Austria | 4,877 | 0.00% |
| 170 | New Caledonia | 4,804 | 0.00% |
| 171 | Bosnia and Herzegovina | 4,081 | 0.00% |
| 172 | Slovakia | 4,032 | 0.00% |
| 173 | Palestine | 3,990 | 0.00% |
| 174 | Lebanon | 3,728 | 0.00% |
| 175 | Kuwait | 3,545 | 0.00% |
| 176 | Swiss | 3,534 | 0.00% |
| 177 | Antigua and Barbuda | 3,185 | 0.00% |
| 178 | Channel Islands | 3,181 | 0.00% |
| 179 | Isle of Man | 2,743 | 0.00% |
| 180 | Tajikistan | 2,724 | 0.00% |
| 181 | Saint-Pierre Island, Micron Island | 2,693 | 0.00% |
| 182 | Reunion | 2,670 | 0.00% |
| 183 | Cook Islands | 2,663 | 0.00% |
| 184 | Lesotho | 2,657 | 0.00% |
| 185 | Jordan | 2,639 | 0.00% |
| 186 | Azerbaijan | 2,622 | 0.00% |
| 187 | Kyrgyzstan | 2,570 | 0.00% |
| 188 | Guadeloupe | 2,460 | 0.00% |
| 189 | Djibouti | 2,323 | 0.00% |
| 190 | Saint Vincent and the Grenadines | 2,137 | 0.00% |
| 191 | North Macedonia | 2,107 | 0.00% |
| 192 | Slovenian | 1,985 | 0.00% |
| 193 | Grenada | 1,835 | 0.00% |
| 194 | French Guiana | 1,759 | 0.00% |
| 195 | Montenegro | 1,701 | 0.00% |
| 196 | Puerto Rico | 1,598 | 0.00% |
| 197 | Martinique | 1,593 | 0.00% |
| 198 | Barbados | 1,542 | 0.00% |
| 199 | Saint Lucia | 1,516 | 0.00% |
| 200 | Macau | 1,500 | 0.00% |
| 201 | Turks and Caicos Islands | 1,297 | 0.00% |
| 202 | Mayotte | 1,257 | 0.00% |
| 203 | Tonga | 1,201 | 0.00% |
| 204 | British Virgin Islands | 1,123 | 0.00% |
| 205 | American Samoa | 891 | 0.00% |
| 206 | Dominica | 854 | 0.00% |
| 207 | Anguilla | 835 | 0.00% |
| 208 | Palau | 798 | 0.00% |
| 209 | St. Christopher’s and Naval | 649 | 0.00% |
| 210 | St. Helena | 509 | 0.00% |
| 211 | Southern region of Bulyeong | 420 | 0.00% |
| 212 | Bermuda shorts | 358 | 0.00% |
| 213 | U.S. Virgin Islands | 338 | 0.00% |
| 214 | Wallis and Futuna Islands | 264 | 0.00% |
| 215 | Nanling St. Martin Island | 253 | 0.00% |
| 216 | butane | 196 | 0.00% |
| 217 | Botswana | 179 | 0.00% |
| 218 | Guam | 162 | 0.00% |
| 219 | eSwatini | 160 | 0.00% |
| 220 | Aruba | 157 | 0.00% |
| 221 | Northern Mariana Islands | 138 | 0.00% |
| 222 | Cayman Islands | 125 | 0.00% |
| 223 | Saint Barthelemy Island | 100 | 0.00% |
| 224 | Saint Martin Island, France | 90 | 0.00% |
| 225 | Tokerau | 70 | 0.00% |
| 226 | Niue | 34 | 0.00% |
| 227 | Mongolia | 25 | 0.00% |
| 227 | Montserrato | 25 | 0.00% |
| 229 | Pitokean Islands | 3 | 0.00% |
| 230 | Gibraltar | 1 | 0.00% |
| 230 | Monaco | 1 | 0.00% |
| total | 214,000,749 | 100.00% | |
As I mentioned in a book titled “ One Book, and Whiskey and Raw Oysters, ”…
Oysters are the product that China accounts for the largest share of global seafood production.…
It's clam season. Today, with COVID-19 making it difficult to eat out, let's take a…
Seirogan, a pill taken for symptoms such as abdominal pain, indigestion, and diarrhea, has a…
A few days ago, I saw a news article saying that the histamine detection kit,…
Today I'd like to talk about one of the most frequently asked questions I get…