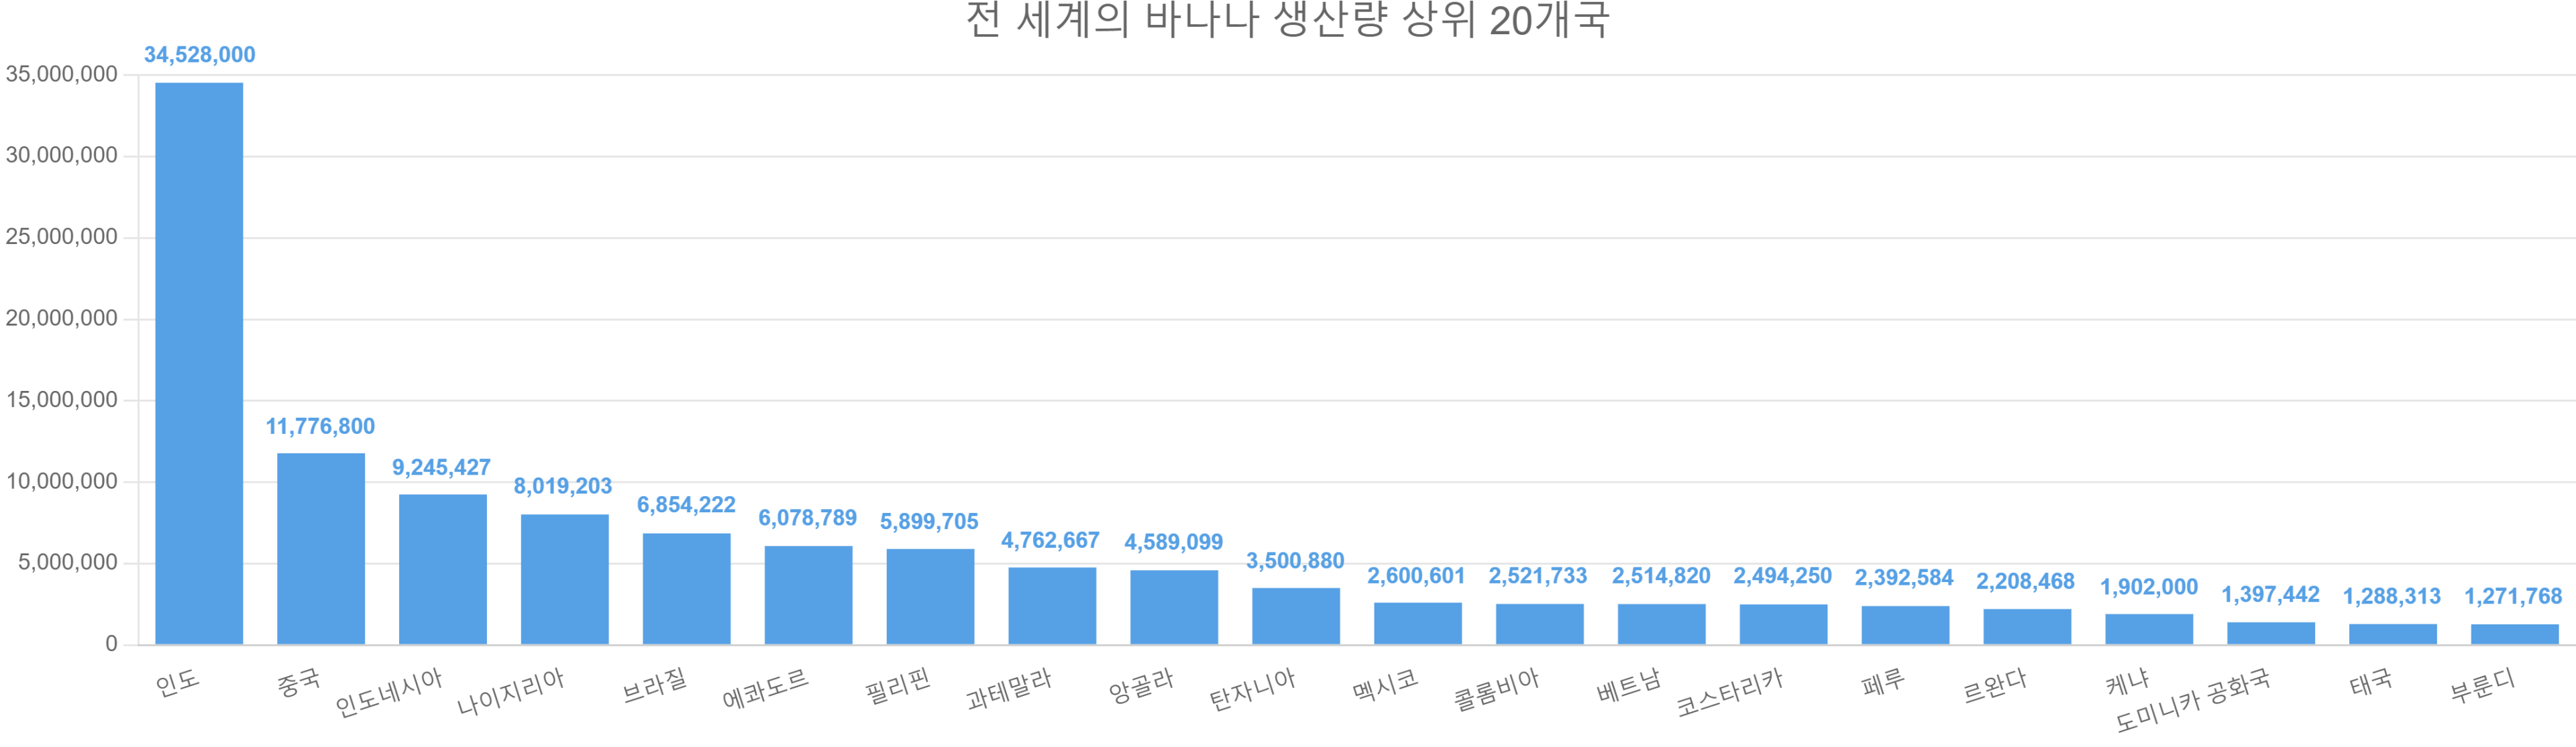
Global banana production statistics

According to FAO data, a total of 135,112,326 tons of bananas were produced worldwide in 2022. India, with a 25.6% share, ranked first with 34,528,000 tons produced, followed by China, with a 8.7% share and 11,776,800 tons of bananas produced.

ranking
nation
Production (tons)
1
India
34,528,000
2
china
11,776,800
3
Indonesia
9,245,427
4
Nigeria
8,019,203
5
brazil
6,854,222
6
Ecuador
6,078,789
7
Philippines
5,899,705
8
Guatemala
4,762,667
9
Angola
4,589,099
10
Tanzania
3,500,880
11
Mexico
2,600,601
12
Colombia
2,521,733
13
vietnam
2,514,820
14
Costa Rica
2,494,250
15
Peru
2,392,584
16
Rwanda
2,208,468
17
Kenya
1,902,000
18
Dominican Republic
1,397,442
19
thailand
1,288,313
20
Burundi
1,271,768
21
Papua New Guinea
1,227,633
22
Egypt
1,213,698
23
Ethiopia
1,096,005
24
Türkiye
997,244
25
method
947,229
26
Cameroon
878,280
27
Bangladesh
826,179
28
Democratic Republic of the Congo
808,443
29
Laos
737,470
30
Honduras
559,263
31
Côte d’Ivoire
531,382
32
Venezuela
528,550
33
Mali
524,896
34
South Africa
502,069
35
Mozambique
466,534
36
Malawi
420,706
37
Panama
397,576
38
Madagascar
388,460
39
Spain
348,870
40
taiwan
334,844
41
Morocco
334,537
42
malaysia
329,573
43
Nepal
317,534
44
Cambodia
310,000
45
Bolivia
308,181
46
australia
280,837
47
Haiti
240,357
48
Cuba
237,354
49
Guinea
229,999
50
france
225,530
51
Pakistan
215,570
52
Zimbabwe
197,458
53
Israel
183,000
54
Argentina
176,655
55
Central Africa
142,580
56
Liberia
142,303
57
Yemen
138,744
58
Iran
132,278
59
Ghana
109,874
60
Puerto Rico
102,164
61
Paraguay
94,319
62
Nicaragua
89,585
63
Republic of the Congo
89,082
64
Belize
86,210
65
Lebanon
81,659
66
Comoros
80,960
67
Jamaica
72,848
68
Saint Vincent and the Grenadines
59,381
69
Burkina Faso
46,360
70
Jordan
42,829
71
Senegal
36,000
72
Equatorial Guinea
30,865
73
Portugal
28,460
74
Togo
24,358
75
Somalia
23,610
76
Saudi Arabia
22,400
77
Samoa
21,974
78
backpack
20,387
79
Guyana
18,687
80
Oman
18,427
81
Gabon
18,282
82
eSwatini
17,957
83
Vanuatu
17,062
84
El Salvador
13,989
85
Dominica
11,524
86
Bahamas
10,114
87
Fiji
10,097
88
Mauritius
9,829
89
Guinea-Bissau
8,392
90
surname
7,947
91
Kiribati
7,541
92
Saint Lucia
7,015
93
Sao Tome and Principe
5,885
94
Cyprus
5,480
95
Greece
4,700
96
Cape Verde
4,628
97
USA
3,517
98
Palestine
3,379
99
Trinidad and Tobago
3,286
100
Grenada
2,558
101
butane
2,139
102
Federated States of Micronesia
2,040
103
Seychelles
1,993
104
New Caledonia
1,879
105
Brunei
1,673
106
Tonga
867
107
Zambia
690
108
East Timor
638
109
United Arab Emirates
336
110
Solomon Islands
319
111
Tuvalu
291
112
Barbados
259
113
Algeria
237
114
Maldive Islands
217
115
French Polynesia
211
116
Syria
197
117
Niue
82
118
japan
18
119
Tokelau
16
120
Antigua and Barbuda
7
121
Cook Islands
4

Global mackerel catch and import/export statistics

Most people believe that mackerel, which is often served on the tables of ordinary people, is from Norway, and many people seem to misunderstand that it is imported because the amount caught in Korea is insufficient. However, in 2022, Korea exported 75,252 tons of mackerel and imported 50,811 tons.

Why do we import Norwegian mackerel even though our country has no shortage of mackerel caught and is actually exporting it?

Most of the countries to which mackerel caught in the waters near our country is exported are African countries. Among the 27 countries to which our country exported more than 50 tons of mackerel in 2022, 14 were African countries, but the amount imported by these countries accounted for 74.3% of our country’s total exports.

The main reason why African countries import such large quantities of mackerel is that they are economically poor, which leads to a lack of fishing boats, fishing technology, and processing facilities.

Additionally, during that time, mackerel was imported from Europe, which was under colonial rule, to supply the protein that was lacking for the people, but as European countries began to limit the mackerel catch and set catch limits for fishing boats to protect fishery resources, the direction of catching large mackerel that could be sold at a high price rather than small mackerel that was cheap also played a role.

Learn more
Daiwa
lure fishing
aquatic plants
Daemodo
fish
Daiwa
lure fishing
bass

However, this does not mean that our country indiscriminately catches small mackerel. Most of the mackerel caught in coastal waters are less than 30cm and 500g on average, and the fact that they are too small to be distributed domestically is the biggest reason why we export a large amount of mackerel to Africa.

Some say that African countries import mackerel from Korea and Japan because they like mackerel with small roe, but that is just nonsense.

It is not that they import small mackerel because they like it, but rather that they cannot import expensive European mackerel because they are financially poor.

In particular, the mass production of such false information through blogs that reproduce materials distributed by government agencies for promotional purposes must be avoided in the future.

Meanwhile, our country imports refrigerated mackerel and frozen mackerel separately, but as can be seen in the picture below, the import volume of refrigerated mackerel is not large, so we will focus on frozen mackerel here.

Before that, looking at FAO statistics, the global mackerel catch in 2020 was 3.521 million tons, with China and Japan taking 1st and 2nd place with 11.1% and 10.7% shares, respectively, while Korea caught 77,650 tons, taking 2.21% of the market share.

Learn more
lure fishing
fish
Daiwa
aquatic plants
lure fishing
Daemodo
bass
Daiwa

ranking
Country name
Catch (tons)
Market share
1
china
392,556
11.15%
2
japan
376,600
10.70%
3
russia
235,717
6.69%
4
India
217,000
6.16%
5
Norway
211,617
6.01%
6
uk
205,676
5.84%
7
Morocco
185,986
5.28%
8
Iceland
151,534
4.30%
9
Ecuador
127,757
3.63%
10
Peru
98,685
2.80%
11
thailand
95,383
2.71%
12
Indonesia
94,667
2.69%
13
Chile
86,045
2.44%
14
Philippines
83,182
2.36%
15
korea
77,650
2.21%
16
Faroe Islands
71,309
2.03%
17
taiwan
65,600
1.86%
18
Ireland
61,241
1.74%
19
Belize
51,410
1.46%
20
Mexico
50,772
1.44%
21
malaysia
50,280
1.43%
22
Spain
49,637
1.41%
23
Georgia
45,000
1.28%
24
Denmark
37,973
1.08%
25
Netherlands
36,257
1.03%
26
Pakistan
36,002
1.02%
27
Angola
30,947
0.88%
28
germany
30,598
0.87%
29
Portugal
27,704
0.79%
30
Greenland
26,577
0.75%
31
Senegal
24,370
0.69%
32
Lithuania
22,548
0.64%
33
france
21,455
0.61%
34
Ghana
13,758
0.39%
35
Argentina
13,532
0.38%
36
Mauritania
12,885
0.37%
37
Oman
10,623
0.30%
38
USA
8,756
0.25%
39
New Zealand
8,527
0.24%
40
Canada
7,809
0.22%
41
Yemen
7,395
0.21%
42
South Africa
5,800
0.16%
43
Poland
5,483
0.16%
44
Egypt
5,048
0.14%
45
brazil
4,815
0.14%
46
Tanzania
4,417
0.13%
47
Iran
3,970
0.11%
48
Sweden
3,689
0.10%
49
Saudi Arabia
3,595
0.10%
50
Côte d’Ivoire
3,060
0.09%
51
Tunisia
2,785
0.08%
52
Türkiye
2,412
0.07%
53
Greece
2,199
0.06%
54
Croatia
2,013
0.06%
55
Venezuela
1,780
0.05%
56
australia
1,196
0.03%
57
Guinea-Bissau
1,114
0.03%
58
Italy
1,068
0.03%
59
Kenya
748
0.02%
60
United Arab Emirates
520
0.01%
61
East Timor
380
0.01%
62
Malta
270
0.01%
63
Fiji
220
0.01%
64
Seychelles
175
0.00%
65
Syria
168
0.00%
66
Gambia
167
0.00%
67
Palestine
150
0.00%
68
Belgium
123
0.00%
69
Albania
116
0.00%
70
Gabon
115
0.00%
71
Algeria
110
0.00%
72
Republic of the Congo
86
0.00%
73
Liberia
70
0.00%
74
Brunei
43
0.00%
75
Eritrea
40
0.00%
75
Israel
40
0.00%
77
Montenegro
35
0.00%
78
Channel Islands
9
0.00%
79
Singapore
7
0.00%
80
Mayotte
6
0.00%
81
Equatorial Guinea
5
0.00%
82
Slovenian
4
0.00%
83
Cyprus
3
0.00%
84
Isle of Man
2
0.00%
Total
3,521,077
100.00%

As previously discussed, in 2022, Norwegian mackerel accounted for 87.6% of all frozen mackerel imports, while Ghana and Nigeria accounted for 33.5% and 30.4% of total exports, respectively. Furthermore, exports to Thailand, the Philippines, and Vietnam, respectively, amounted to 7.9%, 4.1%, and 3.6%, respectively, suggesting that mackerel was processed in these countries and then reimported.

Global catch statistics (as of 2020)

As of 2020, the total global fish catch was 91,420,562 tons, and Korea ranked 18th with a catch of 1,375,415 tons, accounting for 1.5% of the total, followed by China with 14.7%, ranking first.

The statistics are based on FAO data and include fish, shellfish, seaweed, frogs, turtles, and inedible aquatic products, as well as non-edible aquatic products such as pearls and coral, both for subsistence and leisure use.

ranking
nation
Catch (tons)
1
china
13,445,983
2
Indonesia
6,989,382
3
Peru
5,675,209
4
India
5,522,714
5
russia
5,081,017
6
USA
4,253,236
7
vietnam
3,421,880
8
japan
3,215,130
9
Norway
2,603,574
10
Chile
2,182,768
11
Bangladesh
1,919,505
12
Philippines
1,914,854
13
Myanmar
1,853,564
14
thailand
1,655,380
15
Mexico
1,511,893
16
Morocco
1,397,533
17
malaysia
1,393,004
18
korea
1,375,415
19
Iceland
1,034,714
20
Argentina
837,590
21
Spain
804,396
22
Iran
801,881
23
Oman
793,419
24
Nigeria
783,102
25
Canada
739,680
26
Denmark
732,890
27
brazil
709,391
28
Mauritania
678,425
29
Faroe Islands
646,290
30
Ecuador
635,192
31
uk
626,043
32
taiwan
606,526
33
South Africa
602,703
34
Uganda
566,261
35
Cambodia
532,860
36
Pakistan
492,783
37
Tanzania
469,614
38
france
465,872
39
Senegal
451,748
40
Egypt
418,683
41
Mozambique
399,954
42
Sri Lanka
387,043
43
Angola
377,345
44
New Zealand
364,507
45
Turkiye
364,411
46
Ghana
356,361
47
Namibia
329,615
48
Guinea
309,570
49
Netherlands
305,087
50
Cameroon
281,630
51
Greenland
259,209
52
Venezuela
258,424
53
Georgia
231,150
54
Papua New Guinea
217,797
55
Democratic Republic of the Congo
217,750
56
Kiribati
212,751
57
germany
212,095
58
Ireland
208,502
59
Poland
206,390
60
North Korea
202,000
61
Sierra Leone
200,630
62
Federated States of Micronesia
193,748
63
Panama
187,705
64
Belize
186,899
65
australia
179,837
66
Sweden
179,643
67
Malawi
171,115
68
Portugal
159,948
69
Maldive Islands
148,565
70
Italy
141,772
71
Finland
141,128
72
Seychelles
132,416
73
Yemen
131,307
74
Kenya
122,979
75
Hong Kong
119,428
76
Mali
117,690
77
Madagascar
111,160
78
Chad
107,000
79
Zambia
106,836
80
Latvia
103,484
81
Côte d’Ivoire
103,411
82
Tunisia
103,253
83
Nauru
92,388
84
Lithuania
91,083
85
Marshall Islands
88,203
86
Algeria
81,465
87
Colombia
77,315
88
Estonia
74,142
89
Benin
73,965
90
Croatia
71,625
91
Greece
71,476
92
Republic of the Congo
70,637
93
Laos
70,001
94
Ukraine
68,645
95
United Arab Emirates
66,481
96
Falkland Islands
65,978
97
Uruguay
62,880
98
Guinea-Bissau
62,392
99
Saudi Arabia
61,943
100
Ethiopia
60,002
101
El Salvador
52,989
102
Vanuatu
51,560
103
Gambia
50,990
104
Nicaragua
49,703
105
Uzbekistan
46,100
106
Niger
46,000
107
Kazakhstan
45,815
108
Fiji
42,723
109
Solomon Islands
41,017
110
Guyana
39,987
111
Zanzibar, Tanzania
38,105
112
method
37,660
113
Iraq
34,770
114
Liberia
31,629
115
Libya
31,627
116
Somalia
30,000
116
South Sudan
30,000
118
Rwanda
29,979
119
surname
29,772
120
Burkina Faso
29,104
121
Central Africa
29,000
121
Gabon
29,000
123
Mauritius
25,989
124
Curaçao
23,050
125
Nepal
21,000
126
Comoros
20,755
127
Cuba
20,186
128
Belgium
19,954
129
Burundi
19,589
130
Cape Verde
19,292
131
Zimbabwe
18,738
132
Togo
18,034
133
Costa Rica
17,395
134
Paraguay
16,975
135
Haiti
16,350
136
Honduras
15,819
137
catarrh
15,087
138
Turkmenistan
14,605
139
Bahrain
14,414
140
Brunei
13,091
141
Trinidad and Tobago
12,913
142
Jamaica
12,875
143
French Polynesia
12,736
144
Tuvalu
11,294
145
Guatemala
11,276
146
Samoa
9,956
147
Dominican Republic
9,880
148
East Timor
8,300
149
Romania
7,973
150
Albania
7,627
151
Bolivia
7,500
152
Bahamas
7,433
153
Bulgaria
6,296
154
Equatorial Guinea
6,042
155
Sao Tome and Principe
5,617
156
Eritrea
5,565
157
Hungary
5,406
158
Syria
3,845
159
Czechia
3,729
160
Palestine
3,390
161
New Caledonia
3,327
162
Antigua and Barbuda
3,165
163
Kuwait
3,095
164
Lebanon
2,900
165
Isle of Man
2,743
166
Saint-Pierre Island, Micron Island
2,693
167
Reunion
2,660
168
Cook Islands
2,655
169
Guadeloupe
2,415
170
Djibouti
2,323
171
Saint Vincent and the Grenadines
2,124
172
Malta
2,103
173
Azerbaijan
2,089
174
Channel Islands
2,073
175
Israel
2,016
176
Afghanistan
2,000
177
Tajikistan
1,949
178
Serbia
1,932
179
Grenada
1,813
180
French Guiana
1,757
181
Slovakia
1,736
182
Puerto Rico
1,580
183
Martinique
1,551
184
Barbados
1,517
185
Macau
1,500
186
Swiss
1,486
187
Saint Lucia
1,424
188
Singapore
1,418
189
Turks and Caicos Islands
1,297
190
Cyprus
1,266
191
Mayotte
1,237
192
British Virgin Islands
1,122
193
Tonga
1,096
194
Belarus
939
195
American Samoa
871
196
Dominica
854
197
Anguilla
835
198
Montenegro
816
199
Palau
776
200
Saint Christopher and Nevis
647
201
Jordan
584
202
Armenia
542
203
St. Helena
509
204
North Macedonia
473
205
French Southern Territories
420
206
Bermuda shorts
358
207
Austria
350
208
U.S. Virgin Islands
330
209
Slovenian
312
210
Bosnia and Herzegovina
305
211
Wallis and Futuna Islands
264
212
French island of Saint Martin
253
213
Aruba
155
214
Cayman Islands
125
215
Saint Barthelemy Island
100
216
Northern Mariana Islands
97
217
Saint Martin Island, France
90
218
Tokerau
70
219
eSwatini
60
220
Lesotho
57
221
Moldova
50
222
Guam
44
223
Niue
34
224
Botswana
33
225
Mongolia
25
225
Montserrato
25
227
Kyrgyzstan
20
228
butane
15
229
Pitokean Islands
3
230
Gibraltar
1
230
Monaco
1
Total
91,420,562

Global oyster production statistics and Korea’s foreign trade balance

Oysters are the product that China accounts for the largest share of global seafood production.

According to FAO statistics for 2020, while China’s wild oyster catch was so small that it was not counted, its farmed oysters accounted for 86.7% of the world’s farmed oysters and produced 5.42 million tons, accounting for 85.7% of the total global production (the combined production of wild and farmed oysters).

This is 16.6 times the amount produced by our country, which produced a total of 326,000 tons, and 67 times more than France. According to the 2020 statistics released by the FAO, if you look at the graph of the production of 22 countries that produced more than 1,000 tons of oysters, you can get a sense of how much China produces.

ranking
Country name
Catch (tons)
Form (ton)
Total (tons)
%
1
china
0
5,424,632
5,424,632
85.11%
2
korea
25,805
300,084
325,889
5.11%
3
USA
36,067
147,259
183,326
2.88%
4
japan
0
158,900
158,900
2.49%
5
france
11
80,785
80,796
1.27%
6
Mexico
47,714
5,928
53,642
0.84%
7
Philippines
67
53,032
53,099
0.83%
8
taiwan
78
19,165
19,243
0.30%
9
thailand
0
15,747
15,747
0.25%
10
Canada
303
10,643
10,946
0.17%
11
Ireland
0
9,475
9,475
0.15%
12
australia
0
9,011
9,011
0.14%
13
russia
205
4,102
4,307
0.07%
14
India
0
4,000
4,000
0.06%
15
Portugal
35
3,597
3,632
0.06%
16
brazil
1,000
1,700
2,700
0.04%
17
Netherlands
24
2,350
2,374
0.04%
18
uk
16
2,210
2,226
0.03%
19
New Zealand
848
1,364
2,212
0.03%
20
Cuba
0
1,150
1,150
0.02%
21
Spain
8
1,089
1,097
0.02%
22
Channel Islands
0
1,010
1,010
0.02%
Total
112,181
6,257,233
6,369,414
99.93%

The graph below shows our country’s oyster production, which may seem surprising, but our country has been unable to avoid a deficit in its foreign trade balance for oysters since 2005, and since posting a deficit of 1.1746 trillion won in 2018, it has maintained a deficit of around 1 trillion won every year. This may be surprising to many.

※ For convenience, an exchange rate of 1:1,300 won was applied here.

The oyster trade deficit is mostly due to the import of frozen oysters, with China accounting for 45% and Vietnam 28.5% of the trade deficit, and imports from Spain and Somalia also amounting to 19.5 billion and 1.45 billion won, respectively.

On the other hand, it is not known whether it is true or not, but it is said that Henry IV of France ate 300 oysters in one sitting, Napoleon always ate oysters before going into battle, and the philosopher Voltaire enjoyed eating oysters for inspiration, as can be seen from this, France is where all the oysters produced in Europe are gathered and is also ranked 5th in the world in oyster consumption.

As I introduced in a post titled ‘One Book, Whiskey and Raw Oysters’ a long time ago  , the most famous of the European flat oysters that the French enjoy with wine is the Belon Oyster, which comes from the mouth of the Belon River in France. The Belon Oyster was especially certified and protected by the Appellation d’origine contrôlée (AOC), but it became extinct in the 1970s, and now only about 1% of the peak is distributed, using the same species from Ireland.

You can guess how famous the Belon oyster is just by the fact that it is the first image that appears when you Google Belon River. It is a variety that does not grow well, has a weak vitality, and has to be raised in tidal flats, so it takes a lot of time and effort to farm, so it was expensive to begin with, but after it became extinct, its price skyrocketed even more, and now it is being imported in large quantities from China, so its price is rising even more.

In 2022, South Korea produced 325,889 tons of oysters, exporting 41,410 tons (12.7%) and importing 236,442 tons, or 72.6% of total production. This means that one in two oysters (whether fresh or frozen) I’ve ever eaten was imported.

China’s fisheries industry accounts for 40% of global production

On January 19, KBS reported an article titled, “The Return of the ‘Sweeping’ Chinese Fishing Fleet, Advancing Even to South America… “Are They Actually a Maritime Militia?”

The main point of the report was that China’s illegal fishing was widespread throughout the world and that the Chinese government had military objectives behind it.

Late last year, the world widely reported the news that some 300 Chinese fishing boats were threatening the ecosystem and causing many problems for the economies of neighboring countries by conducting sweeping fishing operations in the Galapagos Islands.

The 300 Chinese fishing boats are said to account for 99% of the catch around the Galapagos Islands. The picture below clearly shows how many Chinese fishing boats are sweeping South America.

The yellow and red lines indicate the Chinese fishing boats’ routes, with the yellow line being from 2020 and the red line from 2021.

Looking at this, it’s easy to think that China is sweeping up the world’s seafood, but China’s catch has never exceeded 20% of the world’s total.

Yet, with reports pouring in warning of the depletion of global fisheries and the destruction of ecosystems, what would happen if their catch exceeded 20%?

Currently, the world’s fisheries resources are at only 66% of sustainable levels, and if China continues its uncooperative approach to management, seafood may gradually disappear from our tables.

It may be a small consolation that China’s aquaculture production accounts for over 60% of the world’s total, but without international efforts and China’s awakening, it is clear that the rate at which aquatic resources are being depleted will only accelerate.

Lastly, according to FAO data, the statistics for the combined catch and aquaculture production of fisheries products from 230 countries around the world in 2020 are as follows: China produced 83.93 million tons, taking first place with a 39.22% share, and Korea produced 3.7 million tons, taking 12th place with a 1.73% share.

ranking
Country name
Production (tons)
Market share
1
china
83,929,521
39.22%
2
Indonesia
21,834,396
10.20%
3
India
14,164,000
6.62%
4
vietnam
8,036,572
3.76%
5
Peru
5,819,039
2.72%
6
russia
5,372,211
2.51%
7
USA
4,701,771
2.20%
8
Bangladesh
4,503,371
2.10%
9
Philippines
4,237,686
1.98%
10
japan
4,211,428
1.97%
11
Norway
4,093,986
1.91%
12
korea
3,703,318
1.73%
13
Chile
3,688,254
1.72%
14
Myanmar
2,998,582
1.40%
15
thailand
2,617,847
1.22%
16
Egypt
2,010,579
0.94%
17
malaysia
1,793,021
0.84%
18
Mexico
1,790,586
0.84%
19
Ecuador
1,409,760
0.66%
20
Morocco
1,399,151
0.65%
21
brazil
1,339,591
0.63%
22
Iran
1,282,381
0.60%
23
Spain
1,080,966
0.51%
24
Iceland
1,075,309
0.50%
25
Nigeria
1,044,812
0.49%
26
Cambodia
933,260
0.44%
27
Canada
910,687
0.43%
28
taiwan
885,029
0.41%
29
North Korea
882,300
0.41%
30
uk
847,043
0.40%
31
Argentina
839,674
0.39%
32
Oman
794,726
0.37%
33
Turkiye
785,822
0.37%
34
Denmark
775,519
0.36%
35
Faroe Islands
735,345
0.34%
36
Uganda
690,158
0.32%
37
Mauritania
678,425
0.32%
38
france
657,222
0.31%
39
Pakistan
655,245
0.31%
40
South Africa
612,456
0.29%
41
Tanzania
488,500
0.23%
42
New Zealand
483,089
0.23%
43
Senegal
452,848
0.21%
44
Sri Lanka
429,162
0.20%
45
Ghana
420,371
0.20%
46
Mozambique
403,116
0.19%
47
Angola
379,407
0.18%
48
Netherlands
345,027
0.16%
49
Namibia
329,936
0.15%
50
Venezuela
312,033
0.15%
51
Guinea
310,705
0.15%
52
australia
285,925
0.13%
53
Cameroon
285,186
0.13%
54
Italy
264,550
0.12%
55
Greenland
259,209
0.12%
56
Colombia
256,666
0.12%
57
Poland
254,090
0.12%
58
Ireland
246,253
0.12%
59
germany
244,353
0.11%
60
Georgia
233,177
0.11%
61
Papua New Guinea
223,899
0.10%
62
Democratic Republic of the Congo
221,340
0.10%
63
Kiribati
212,753
0.10%
64
Greece
203,213
0.09%
65
Sierra Leone
200,715
0.09%
66
Laos
200,021
0.09%
67
Federated States of Micronesia
193,748
0.09%
68
Sweden
191,733
0.09%
69
Panama
191,584
0.09%
70
Belize
187,464
0.09%
71
Malawi
180,508
0.08%
72
Portugal
174,500
0.08%
73
Saudi Arabia
161,849
0.08%
74
Finland
156,181
0.07%
75
Zambia
152,506
0.07%
76
Maldive Islands
148,565
0.07%
77
Uzbekistan
144,103
0.07%
78
Kenya
143,810
0.07%
79
Seychelles
132,416
0.06%
80
Yemen
131,307
0.06%
81
Zanzibar, Tanzania
127,788
0.06%
82
Tunisia
126,739
0.06%
83
Mali
125,376
0.06%
84
Madagascar
124,710
0.06%
85
Hong Kong
123,263
0.06%
86
Côte d’Ivoire
108,031
0.05%
87
Chad
107,105
0.05%
88
Latvia
104,201
0.05%
89
Nepal
97,822
0.05%
90
Lithuania
95,561
0.04%
91
Croatia
93,343
0.04%
92
Nauru
92,389
0.04%
93
Marshall Islands
88,212
0.04%
94
Ukraine
87,213
0.04%
95
Honduras
86,970
0.04%
96
Algeria
86,901
0.04%
97
Nicaragua
79,113
0.04%
98
backpack
76,952
0.04%
99
Estonia
75,233
0.04%
100
Republic of the Congo
71,537
0.03%
101
United Arab Emirates
69,529
0.03%
102
Falkland Islands
65,978
0.03%
103
Uruguay
62,983
0.03%
104
Guinea-Bissau
62,392
0.03%
105
El Salvador
61,489
0.03%
106
Ethiopia
60,536
0.03%
107
Iraq
57,474
0.03%
108
Kazakhstan
52,610
0.02%
109
Vanuatu
51,563
0.02%
110
Gambia
51,023
0.02%
111
method
47,510
0.02%
112
Niger
46,649
0.02%
113
Solomon Islands
46,521
0.02%
114
Cuba
46,386
0.02%
115
Guatemala
44,927
0.02%
116
Fiji
43,045
0.02%
117
Guyana
40,125
0.02%
118
Rwanda
37,038
0.02%
119
Zimbabwe
34,163
0.02%
120
Costa Rica
33,664
0.02%
121
Liberia
31,884
0.01%
122
Libya
31,637
0.01%
123
Paraguay
31,075
0.01%
124
South Sudan
30,030
0.01%
125
Somalia
30,000
0.01%
126
surname
29,809
0.01%
127
Burkina Faso
29,755
0.01%
128
Mauritius
29,287
0.01%
129
Central Africa
29,219
0.01%
130
Gabon
29,060
0.01%
131
Czechia
24,130
0.01%
132
Hungary
23,780
0.01%
133
Curaçao
23,050
0.01%
134
Malta
21,933
0.01%
135
Bulgaria
21,348
0.01%
136
Burundi
21,039
0.01%
137
Comoros
20,755
0.01%
138
Romania
20,173
0.01%
139
Belgium
20,163
0.01%
140
Cape Verde
19,314
0.01%
141
Armenia
18,892
0.01%
142
Togo
18,764
0.01%
143
Haiti
17,910
0.01%
144
Albania
16,911
0.01%
145
Israel
16,716
0.01%
146
Brunei
16,591
0.01%
147
catarrh
15,109
0.01%
148
Turkmenistan
14,755
0.01%
149
Bahrain
14,420
0.01%
150
French Polynesia
14,107
0.01%
151
Jamaica
13,792
0.01%
152
Trinidad and Tobago
12,917
0.01%
153
Moldova
12,650
0.01%
154
Dominican Republic
12,560
0.01%
155
Tuvalu
11,297
0.01%
156
Bolivia
11,220
0.01%
157
Belarus
10,205
0.00%
158
Afghanistan
10,050
0.00%
159
Samoa
9,966
0.00%
160
East Timor
9,135
0.00%
161
Cyprus
8,608
0.00%
162
Serbia
7,942
0.00%
163
Bahamas
7,439
0.00%
164
Singapore
6,247
0.00%
165
Syria
6,145
0.00%
166
Equatorial Guinea
6,057
0.00%
167
Sao Tome and Principe
5,617
0.00%
168
Eritrea
5,565
0.00%
169
Austria
4,877
0.00%
170
New Caledonia
4,804
0.00%
171
Bosnia and Herzegovina
4,081
0.00%
172
Slovakia
4,032
0.00%
173
Palestine
3,990
0.00%
174
Lebanon
3,728
0.00%
175
Kuwait
3,545
0.00%
176
Swiss
3,534
0.00%
177
Antigua and Barbuda
3,185
0.00%
178
Channel Islands
3,181
0.00%
179
Isle of Man
2,743
0.00%
180
Tajikistan
2,724
0.00%
181
Saint-Pierre Island, Micron Island
2,693
0.00%
182
Reunion
2,670
0.00%
183
Cook Islands
2,663
0.00%
184
Lesotho
2,657
0.00%
185
Jordan
2,639
0.00%
186
Azerbaijan
2,622
0.00%
187
Kyrgyzstan
2,570
0.00%
188
Guadeloupe
2,460
0.00%
189
Djibouti
2,323
0.00%
190
Saint Vincent and the Grenadines
2,137
0.00%
191
North Macedonia
2,107
0.00%
192
Slovenian
1,985
0.00%
193
Grenada
1,835
0.00%
194
French Guiana
1,759
0.00%
195
Montenegro
1,701
0.00%
196
Puerto Rico
1,598
0.00%
197
Martinique
1,593
0.00%
198
Barbados
1,542
0.00%
199
Saint Lucia
1,516
0.00%
200
Macau
1,500
0.00%
201
Turks and Caicos Islands
1,297
0.00%
202
Mayotte
1,257
0.00%
203
Tonga
1,201
0.00%
204
British Virgin Islands
1,123
0.00%
205
American Samoa
891
0.00%
206
Dominica
854
0.00%
207
Anguilla
835
0.00%
208
Palau
798
0.00%
209
St. Christopher’s and Naval
649
0.00%
210
St. Helena
509
0.00%
211
Southern region of Bulyeong
420
0.00%
212
Bermuda shorts
358
0.00%
213
U.S. Virgin Islands
338
0.00%
214
Wallis and Futuna Islands
264
0.00%
215
Nanling St. Martin Island
253
0.00%
216
butane
196
0.00%
217
Botswana
179
0.00%
218
Guam
162
0.00%
219
eSwatini
160
0.00%
220
Aruba
157
0.00%
221
Northern Mariana Islands
138
0.00%
222
Cayman Islands
125
0.00%
223
Saint Barthelemy Island
100
0.00%
224
Saint Martin Island, France
90
0.00%
225
Tokerau
70
0.00%
226
Niue
34
0.00%
227
Mongolia
25
0.00%
227
Montserrato
25
0.00%
229
Pitokean Islands
3
0.00%
230
Gibraltar
1
0.00%
230
Monaco
1
0.00%
total
214,000,749
100.00%