
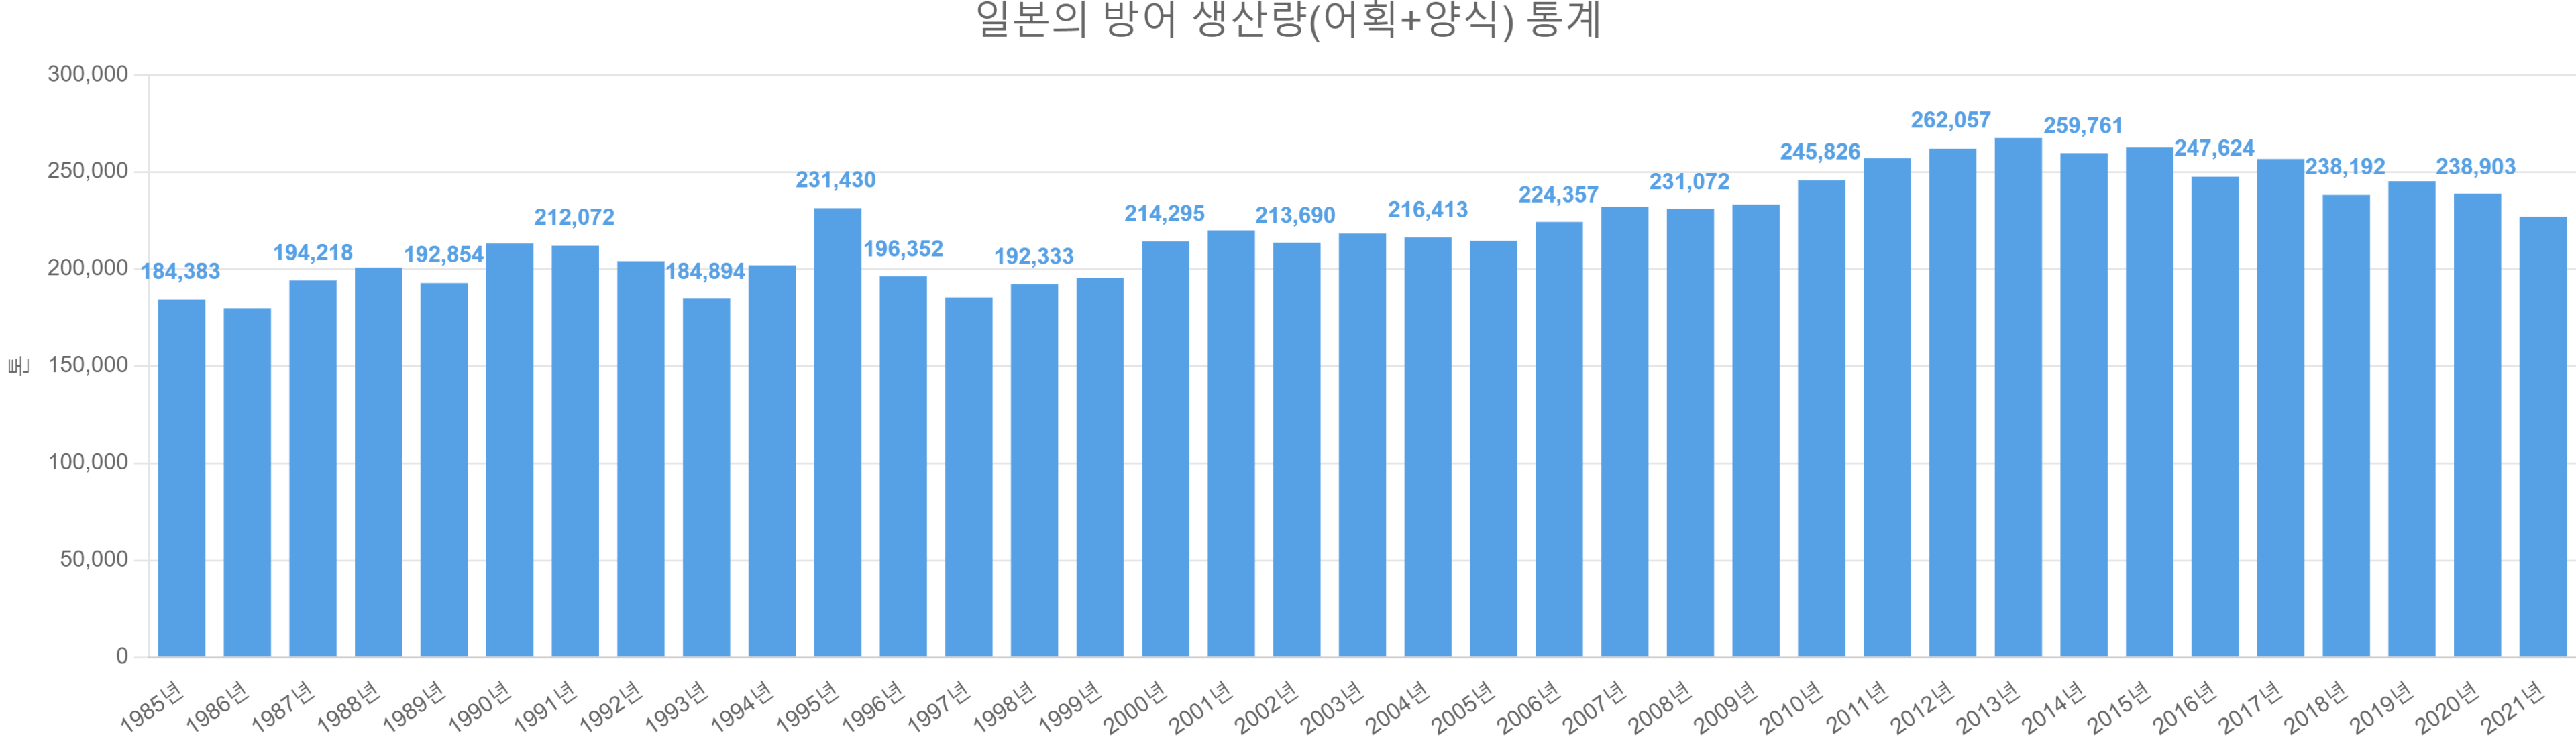
Statistics on Japanese Yellowtail production (catch + aquaculture)
In the article ” How Much Japanese Yellowtail Have We Eaten? “, we looked into the influx of Japanese yellowtail imported every winter. However, the total yellowtail produced in Korea accounts for less than 7% of Japan’s combined catch and farmed yellowtail production. Therefore, today we’ll look into Japan’s yellowtail production (both caught and farmed).
|
year
|
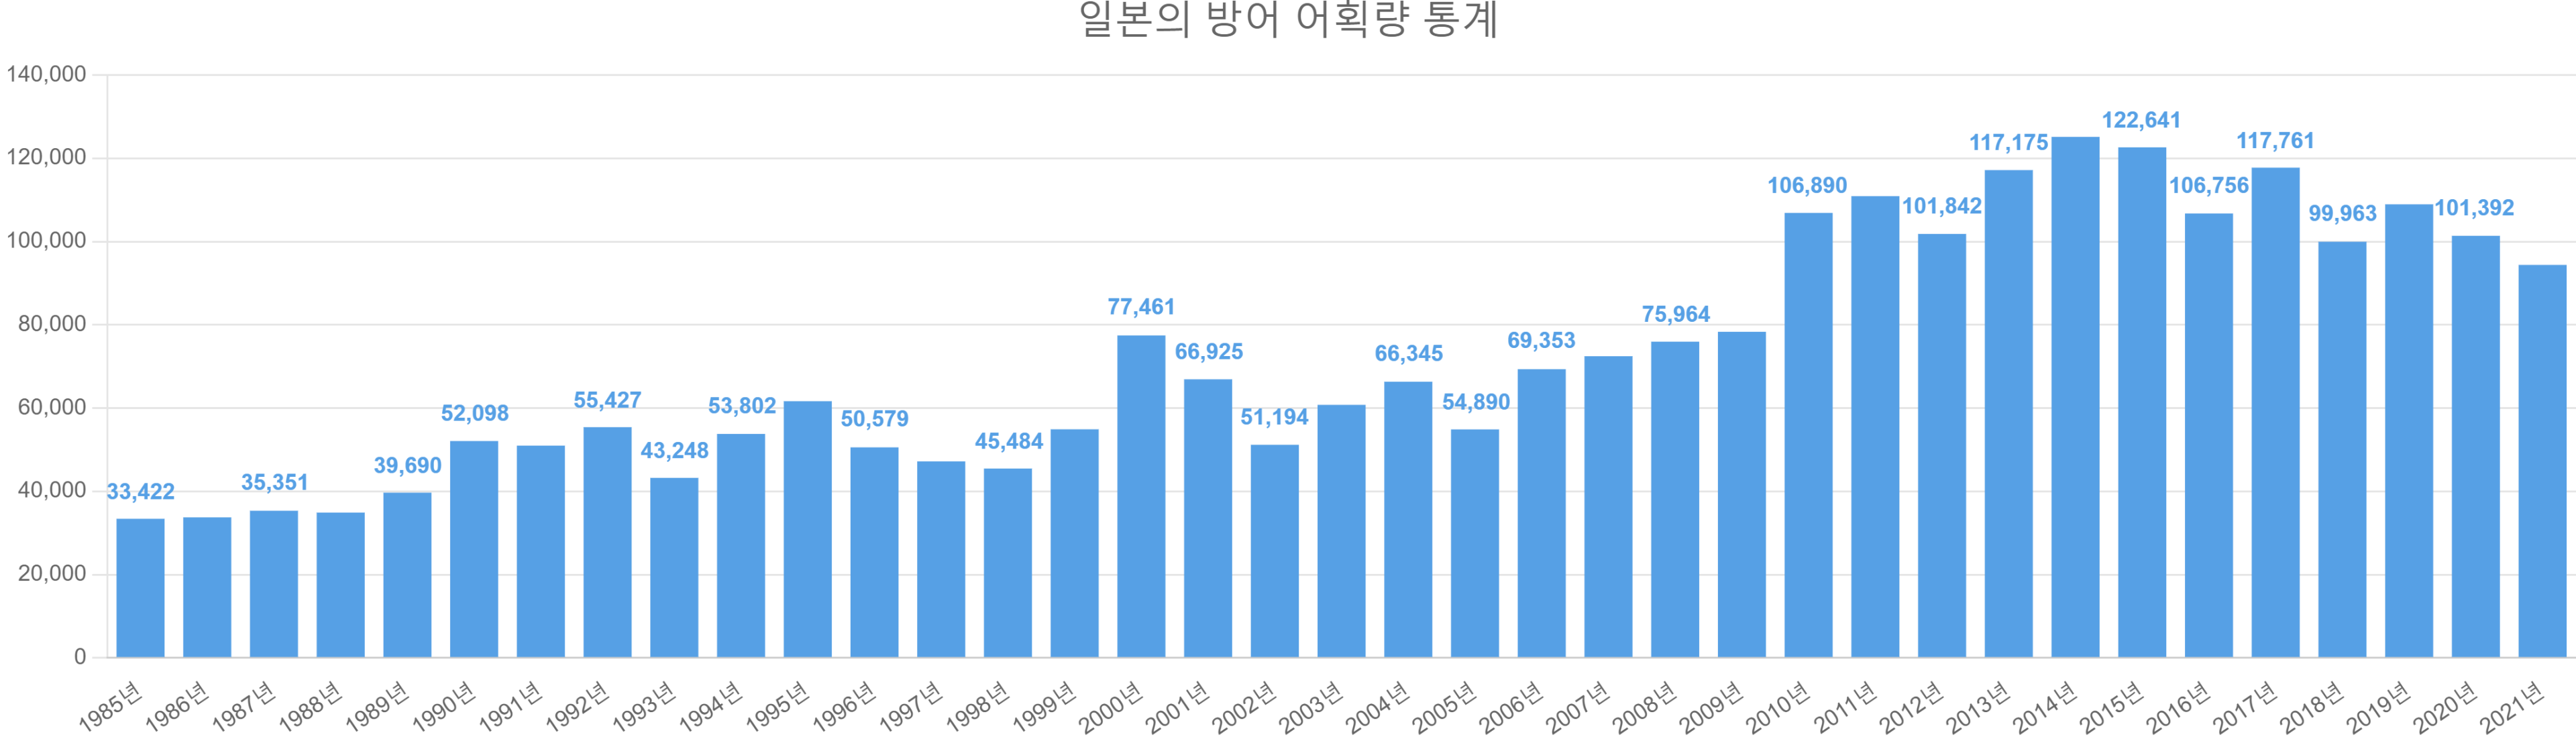
catch (ton)
|
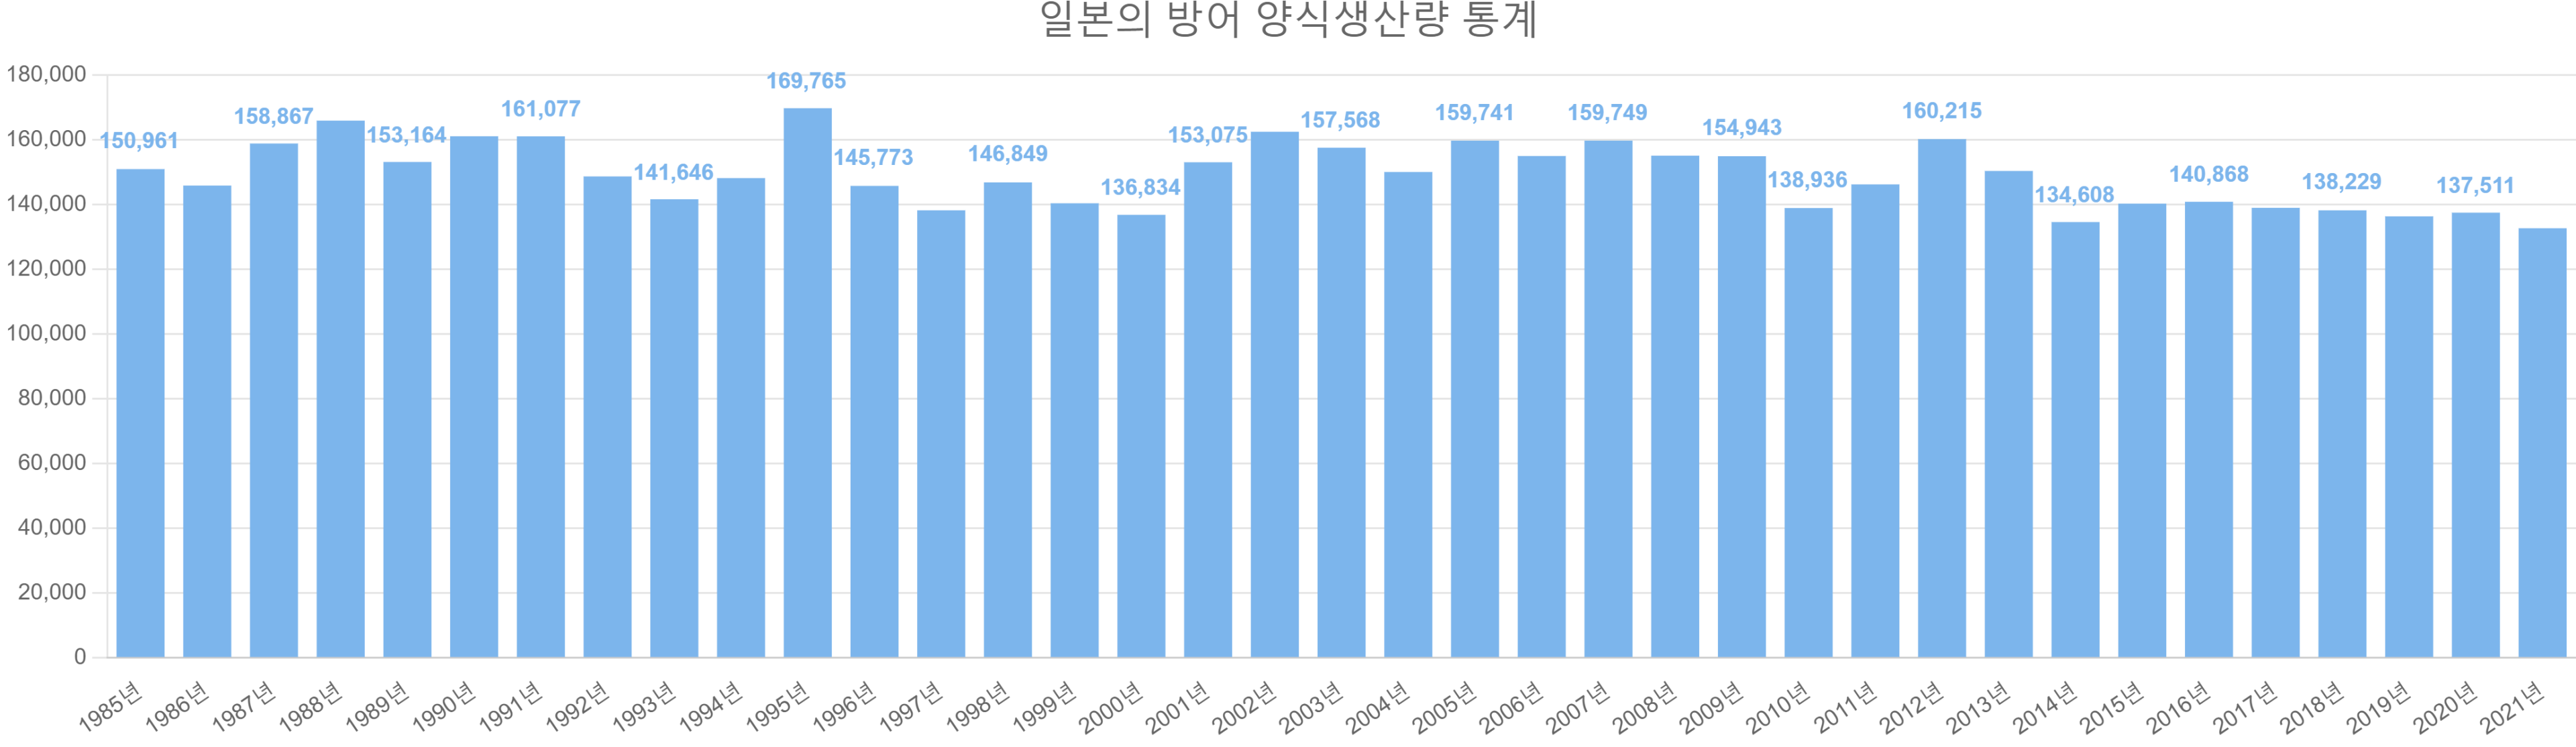
Form (ton)
|
Total (ton)
|
|
1985
|
33,422
|
150,961
|
184,383
|
|
1986
|
33,764
|
145,878
|
179,642
|
|
1987
|
35,351
|
158,867
|
194,218
|
|
1988
|
34,909
|
165,928
|
200,837
|
|
1989
|
39,690
|
153,164
|
192,854
|
|
1990
|
52,098
|
161,106
|
213,204
|
|
1991
|
50,995
|
161,077
|
212,072
|
|
1992
|
55,427
|
148,701
|
204,128
|
|
1993
|
43,248
|
141,646
|
184,894
|
|
1994
|
53,802
|
148,181
|
201,983
|
|
1995
|
61,665
|
169,765
|
231,430
|
|
1996
|
50,579
|
145,773
|
196,352
|
|
1997
|
47,211
|
138,234
|
185,445
|
|
1998
|
45,484
|
146,849
|
192,333
|
|
1999
|
54,918
|
140,411
|
195,329
|
|
2000
|
77,461
|
136,834
|
214,295
|
|
2001
|
66,925
|
153,075
|
220,000
|
|
2002
|
51,194
|
162,496
|
213,690
|
|
2003
|
60,787
|
157,568
|
218,355
|
|
2004
|
66,345
|
150,068
|
216,413
|
|
2005
|
54,890
|
159,741
|
214,631
|
|
2006
|
69,353
|
155,004
|
224,357
|
|
2007
|
72,470
|
159,749
|
232,219
|
|
2008
|
75,964
|
155,108
|
231,072
|
|
2009
|
78,334
|
154,943
|
233,277
|
|
2010
|
106,890
|
138,936
|
245,826
|
|
2011
|
110,917
|
146,240
|
257,157
|
|
2012
|
101,842
|
160,215
|
262,057
|
|
2013
|
117,175
|
150,387
|
267,562
|
|
2014
|
125,153
|
134,608
|
259,761
|
|
2015
|
122,641
|
140,292
|
262,933
|
|
2016
|
106,756
|
140,868
|
247,624
|
|
2017
|
117,761
|
138,999
|
256,760
|
|
2018
|
99,963
|
138,229
|
238,192
|
|
2019
|
108,957
|
136,367
|
245,324
|
|
2020
|
101,392
|
137,511
|
238,903
|
|
2021
|
94,400
|
132,700
|
227,100
|


Leave a Reply
Want to join the discussion?Feel free to contribute!